-
Notifications
You must be signed in to change notification settings - Fork 119
Prometheus doc update #4137
New issue
Have a question about this project? Sign up for a free GitHub account to open an issue and contact its maintainers and the community.
By clicking “Sign up for GitHub”, you agree to our terms of service and privacy statement. We’ll occasionally send you account related emails.
Already on GitHub? Sign in to your account
base: latest
Are you sure you want to change the base?
Prometheus doc update #4137
Changes from 6 commits
c0b2bf2
7a866e4
a4e9583
c6d88a6
9edd53b
9a8b4f9
f4c6eef
17af3fa
1895215
File filter
Filter by extension
Conversations
Jump to
Diff view
Diff view
There are no files selected for viewing
| Original file line number | Diff line number | Diff line change |
|---|---|---|
|
|
@@ -2,119 +2,224 @@ import IntegrationPrereqs from "versionContent/_partials/_integration-prereqs.md | |
|
|
||
| [Prometheus][prometheus] is an open-source monitoring system with a dimensional data model, flexible query language, and a modern alerting approach. | ||
|
|
||
| This page shows you how to export your $SERVICE_SHORT telemetry to Prometheus: | ||
| This page shows you how to export your $SERVICE_SHORT metrics to Prometheus: | ||
|
|
||
| - For $CLOUD_LONG, using a dedicated Prometheus exporter in $CONSOLE. | ||
| - For $SELF_LONG, using [PostgreSQL Exporter][postgresql-exporter]. | ||
| - For $CLOUD_LONG, using a dedicated Prometheus exporter in $CONSOLE or [PostgreSQL Exporter][postgresql-exporter]. | ||
| - For $SELF_LONG, using [PostgreSQL Exporter][postgresql-exporter]. | ||
|
|
||
| ## Prerequisites | ||
| ## Prerequisites | ||
|
|
||
| <Availability products={['cloud']} price_plans={['enterprise']} /> | ||
|
|
||
| To follow the steps on this page: | ||
|
|
||
| - [Download and run Prometheus][install-prometheus]. | ||
| - For $CLOUD_LONG: | ||
|
|
||
| Create a target [$SERVICE_LONG][create-service] with the time-series and analytics capability enabled. | ||
| - Create a target [$SERVICE_LONG][create-service] with the time-series and analytics capability enabled. You need your [connection details][connection-info]. | ||
| - To use PostgreSQL Exporter: [install PostgreSQL Exporter][install-exporter] in the same AWS region as your $SERVICE_SHORT. | ||
| - For $SELF_LONG: | ||
|
|
||
| - Create a target [self-hosted $TIMESCALE_DB][enable-timescaledb] instance. You need your [connection details][connection-info]. | ||
| - [Install PostgreSQL Exporter][install-exporter]. | ||
| To reduce latency and potential data transfer costs, install Prometheus and PostgreSQL Exporter on a machine in the same AWS region as your $SERVICE_LONG. | ||
| - [Install PostgreSQL Exporter][install-exporter] in the same AWS region as your database. | ||
|
|
||
| - [Download and run Prometheus][install-prometheus] in the same AWS region as your $SERVICE_LONG or database. | ||
|
|
||
| ## Export $SERVICE_SHORT telemetry to Prometheus | ||
| ## Export metrics to Prometheus | ||
|
|
||
| To export your data, do the following: | ||
|
|
||
| <Tabs label="Export metrics to Prometheus"> | ||
|
|
||
| <Tab title="Timescale Cloud"> | ||
|
|
||
| You can export different metrics from your $SERVICE_LONG using the $CONSOLE Prometheus exporter and PostgreSQL Exporter. | ||
atovpeko marked this conversation as resolved.
Show resolved
Hide resolved
|
||
|
|
||
| The Prometheus exporter exposes the metrics related to the $SERVICE_LONG like CPU, memory, and storage. PostgreSQL Exporter exposes metrics that you define, excluding the system metrics available with the $CONSOLE exporter. | ||
|
|
||
| The Prometheus exporter is available for [Scale and Enterprise][pricing-plan-features] pricing plans. | ||
atovpeko marked this conversation as resolved.
Show resolved
Hide resolved
|
||
|
|
||
| <Tabs> | ||
|
|
||
| <Tab title="Using Timescale Console exporter"> | ||
|
|
||
| <Procedure> | ||
|
|
||
| To export metrics from a $SERVICE_LONG, you create a dedicated Prometheus exporter in $CONSOLE, attach it to your $SERVICE_SHORT, then configure Prometheus to scrape metrics using the exposed URL. The Prometheus exporter exposes the metrics related to the $SERVICE_LONG like CPU, memory, and storage. To scrape other metrics, use PostgreSQL Exporter as described for $SELF_LONG. The Prometheus exporter is available for [Scale and Enterprise][pricing-plan-features] pricing plans. | ||
| You create a Prometheus exporter in $CONSOLE, attach it to your $SERVICE_SHORT, then configure Prometheus to scrape metrics using the exposed URL. | ||
|
|
||
| 1. **Create a Prometheus exporter** | ||
|
|
||
| 1. In [$CONSOLE][open-console], click `Exporters` > `+ New exporter`. | ||
| 1. In [$CONSOLE][open-console], click `Exporters` > `+ New exporter`. | ||
|
|
||
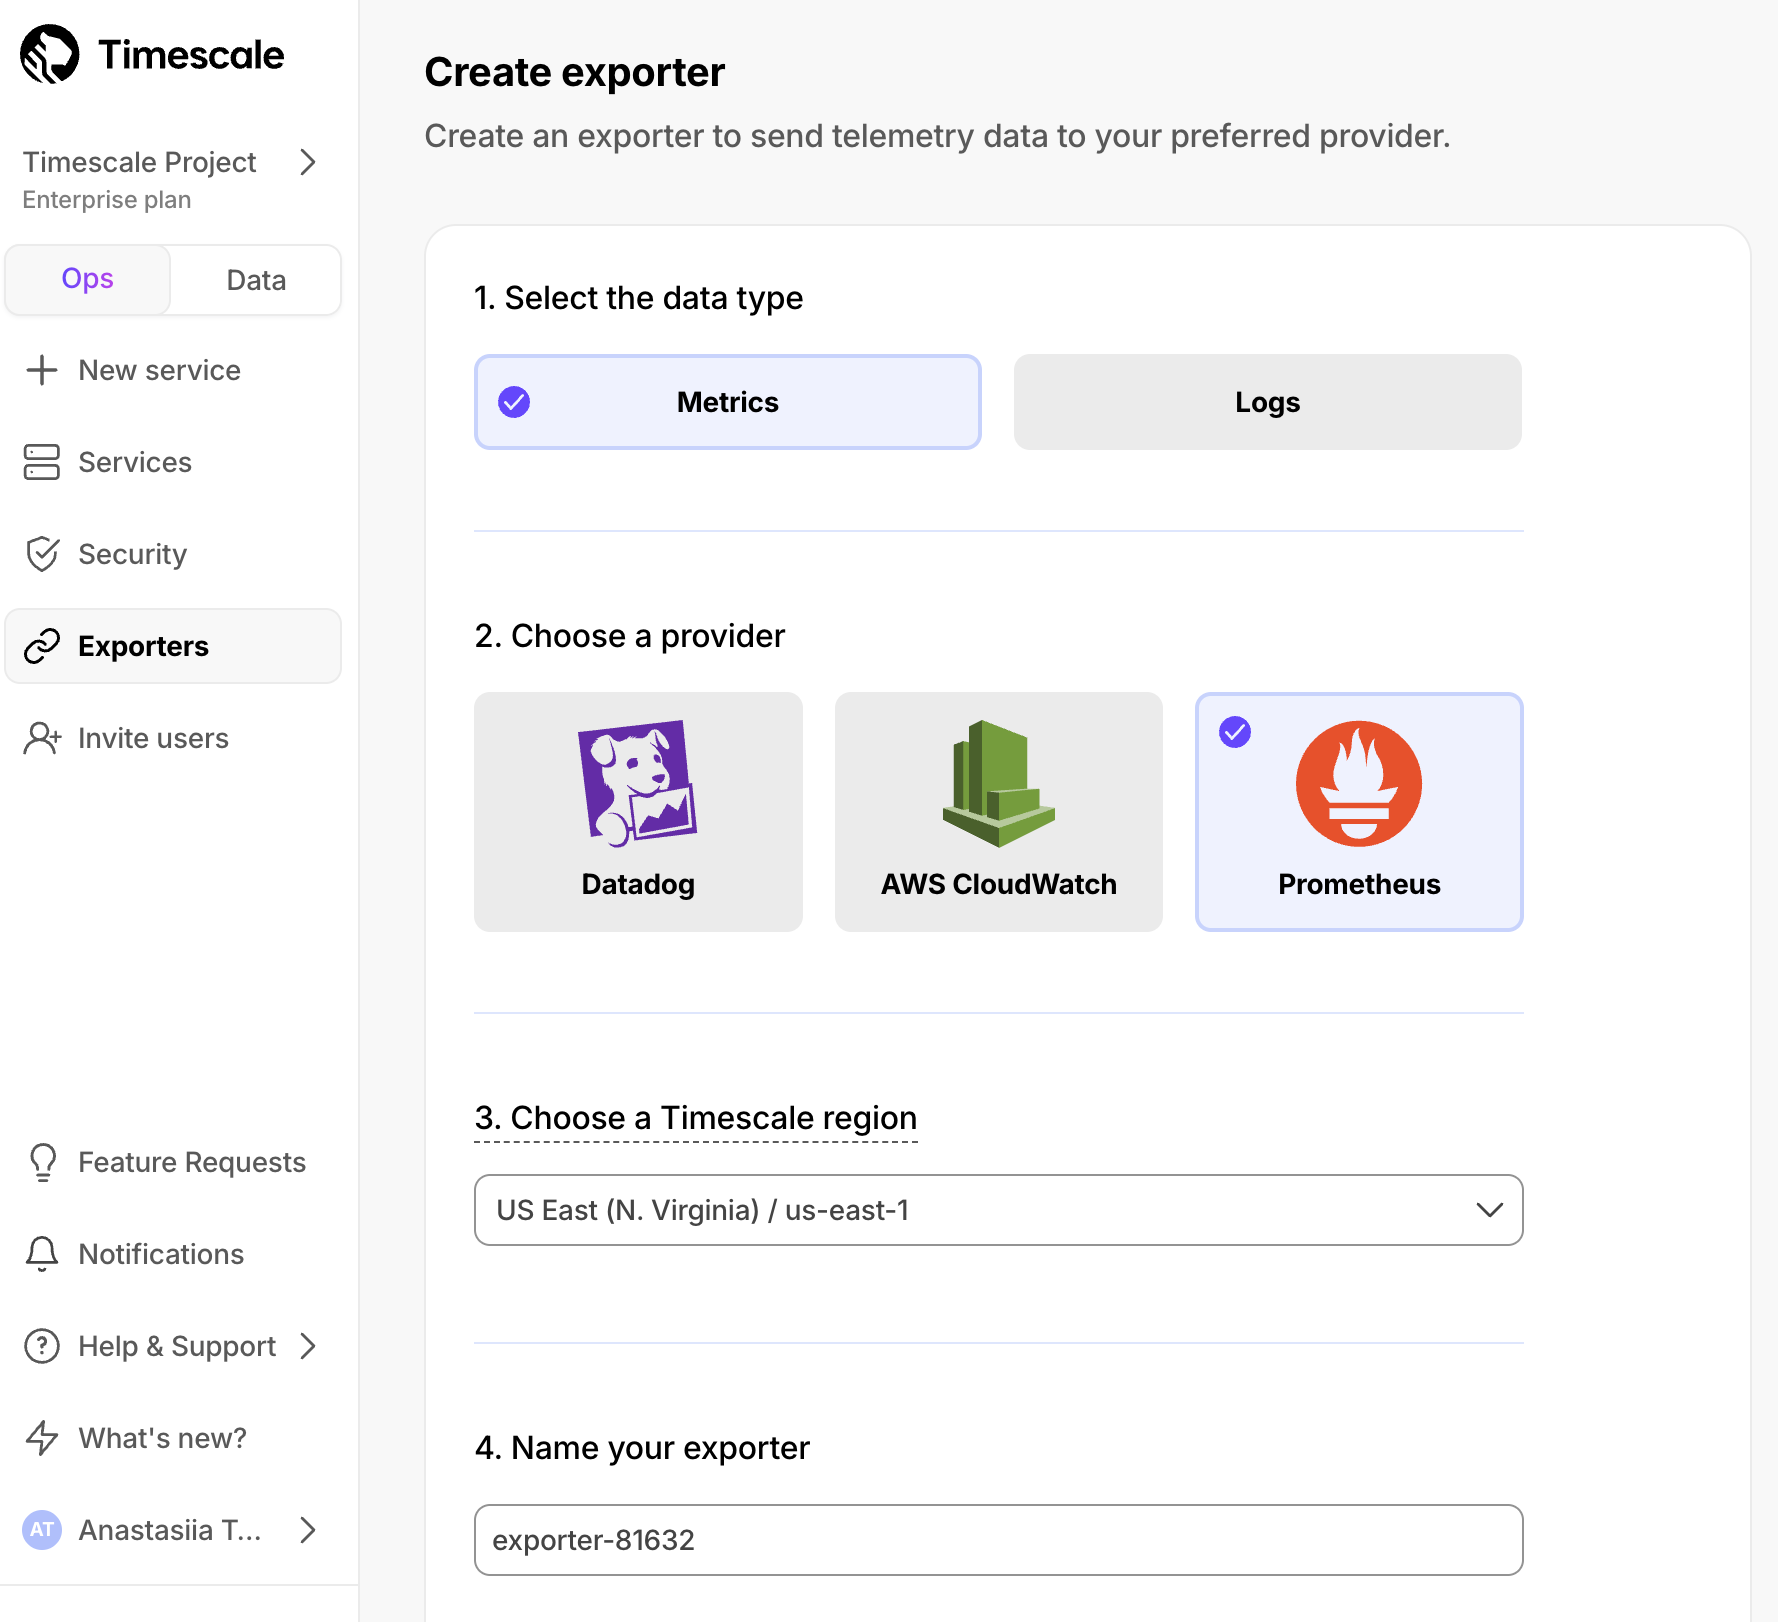
| 1. Select `Metrics` for data type and `Prometheus` for provider. | ||
| 1. Select `Metrics` for data type and `Prometheus` for provider. | ||
|
|
||
|  | ||
|  | ||
|
|
||
| 1. Choose the region for the exporter. Only $SERVICE_SHORTs in the same project and region can be attached to this exporter. | ||
|
|
||
| 1. Name your exporter. | ||
| 1. Choose the region for the exporter. Only $SERVICE_SHORTs in the same project and region can be attached to this exporter. | ||
|
|
||
| 1. Change the auto-generated Prometheus credentials, if needed. See [official documentation][prometheus-authentication] on basic authentication in Prometheus. | ||
| 1. Name your exporter. | ||
|
|
||
| 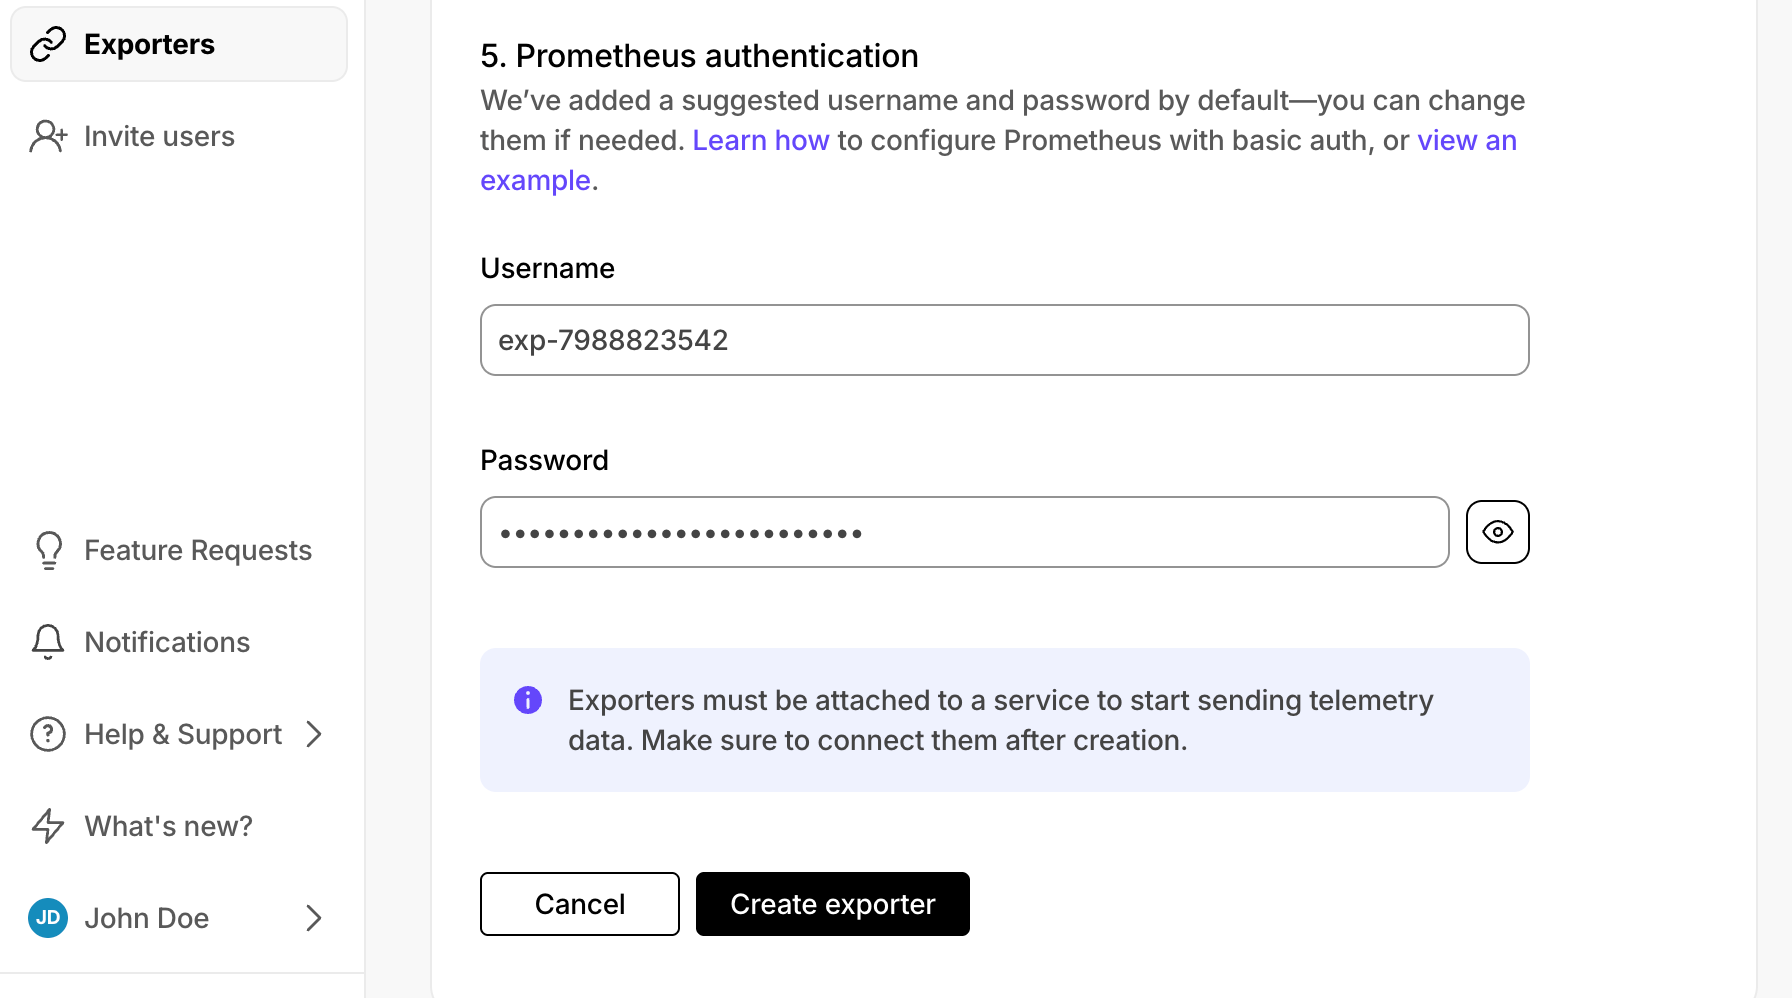 | ||
| 1. Change the auto-generated Prometheus credentials, if needed. See [official documentation][prometheus-authentication] on basic authentication in Prometheus. | ||
|
|
||
|  | ||
|
|
||
| 1. **Attach the exporter to a $SERVICE_SHORT** | ||
|
|
||
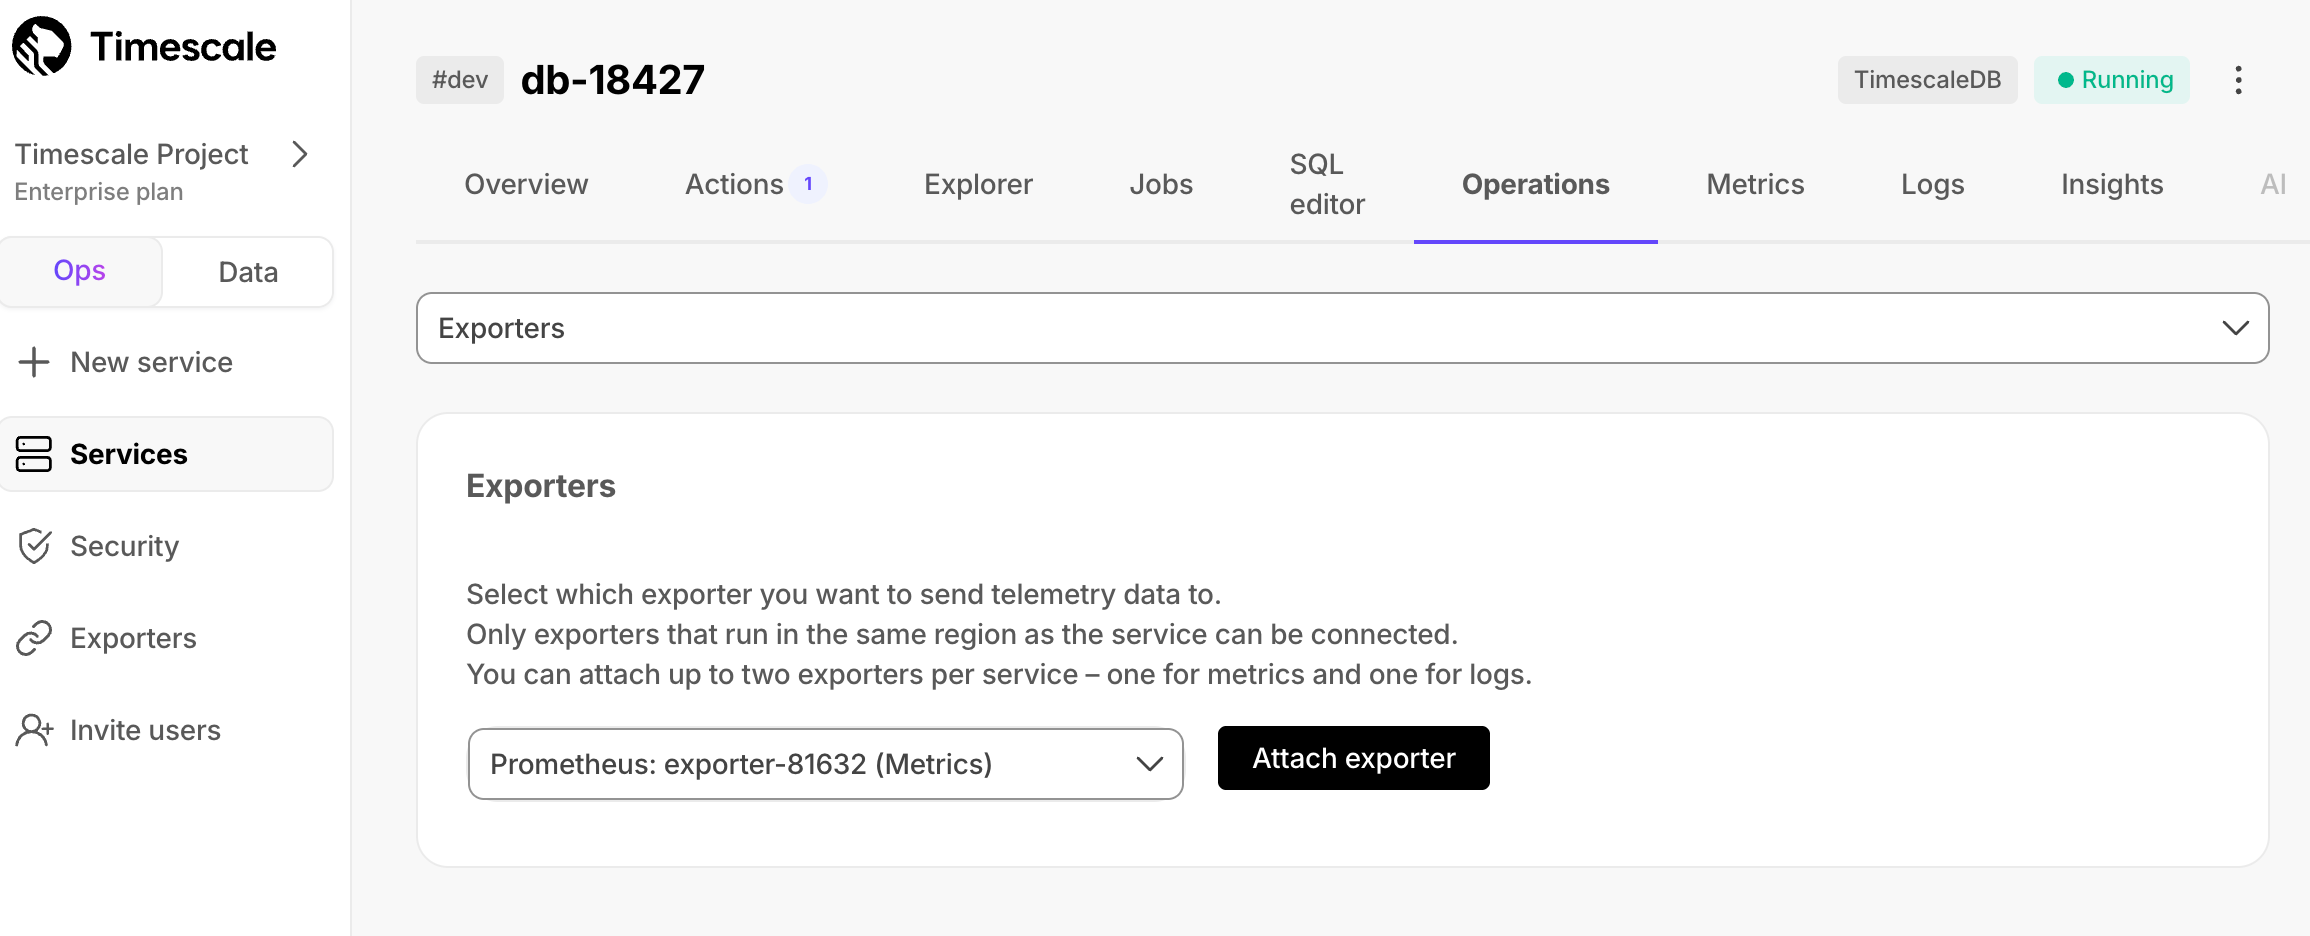
| 1. Select a $SERVICE_SHORT, then click `Operations` > `Exporters`. | ||
| 1. Select a $SERVICE_SHORT, then click `Operations` > `Exporters`. | ||
|
|
||
| 1. Select the exporter in the drop-down, then click `Attach exporter`. | ||
| 1. Select the exporter in the drop-down, then click `Attach exporter`. | ||
|
|
||
|  | ||
|  | ||
|
|
||
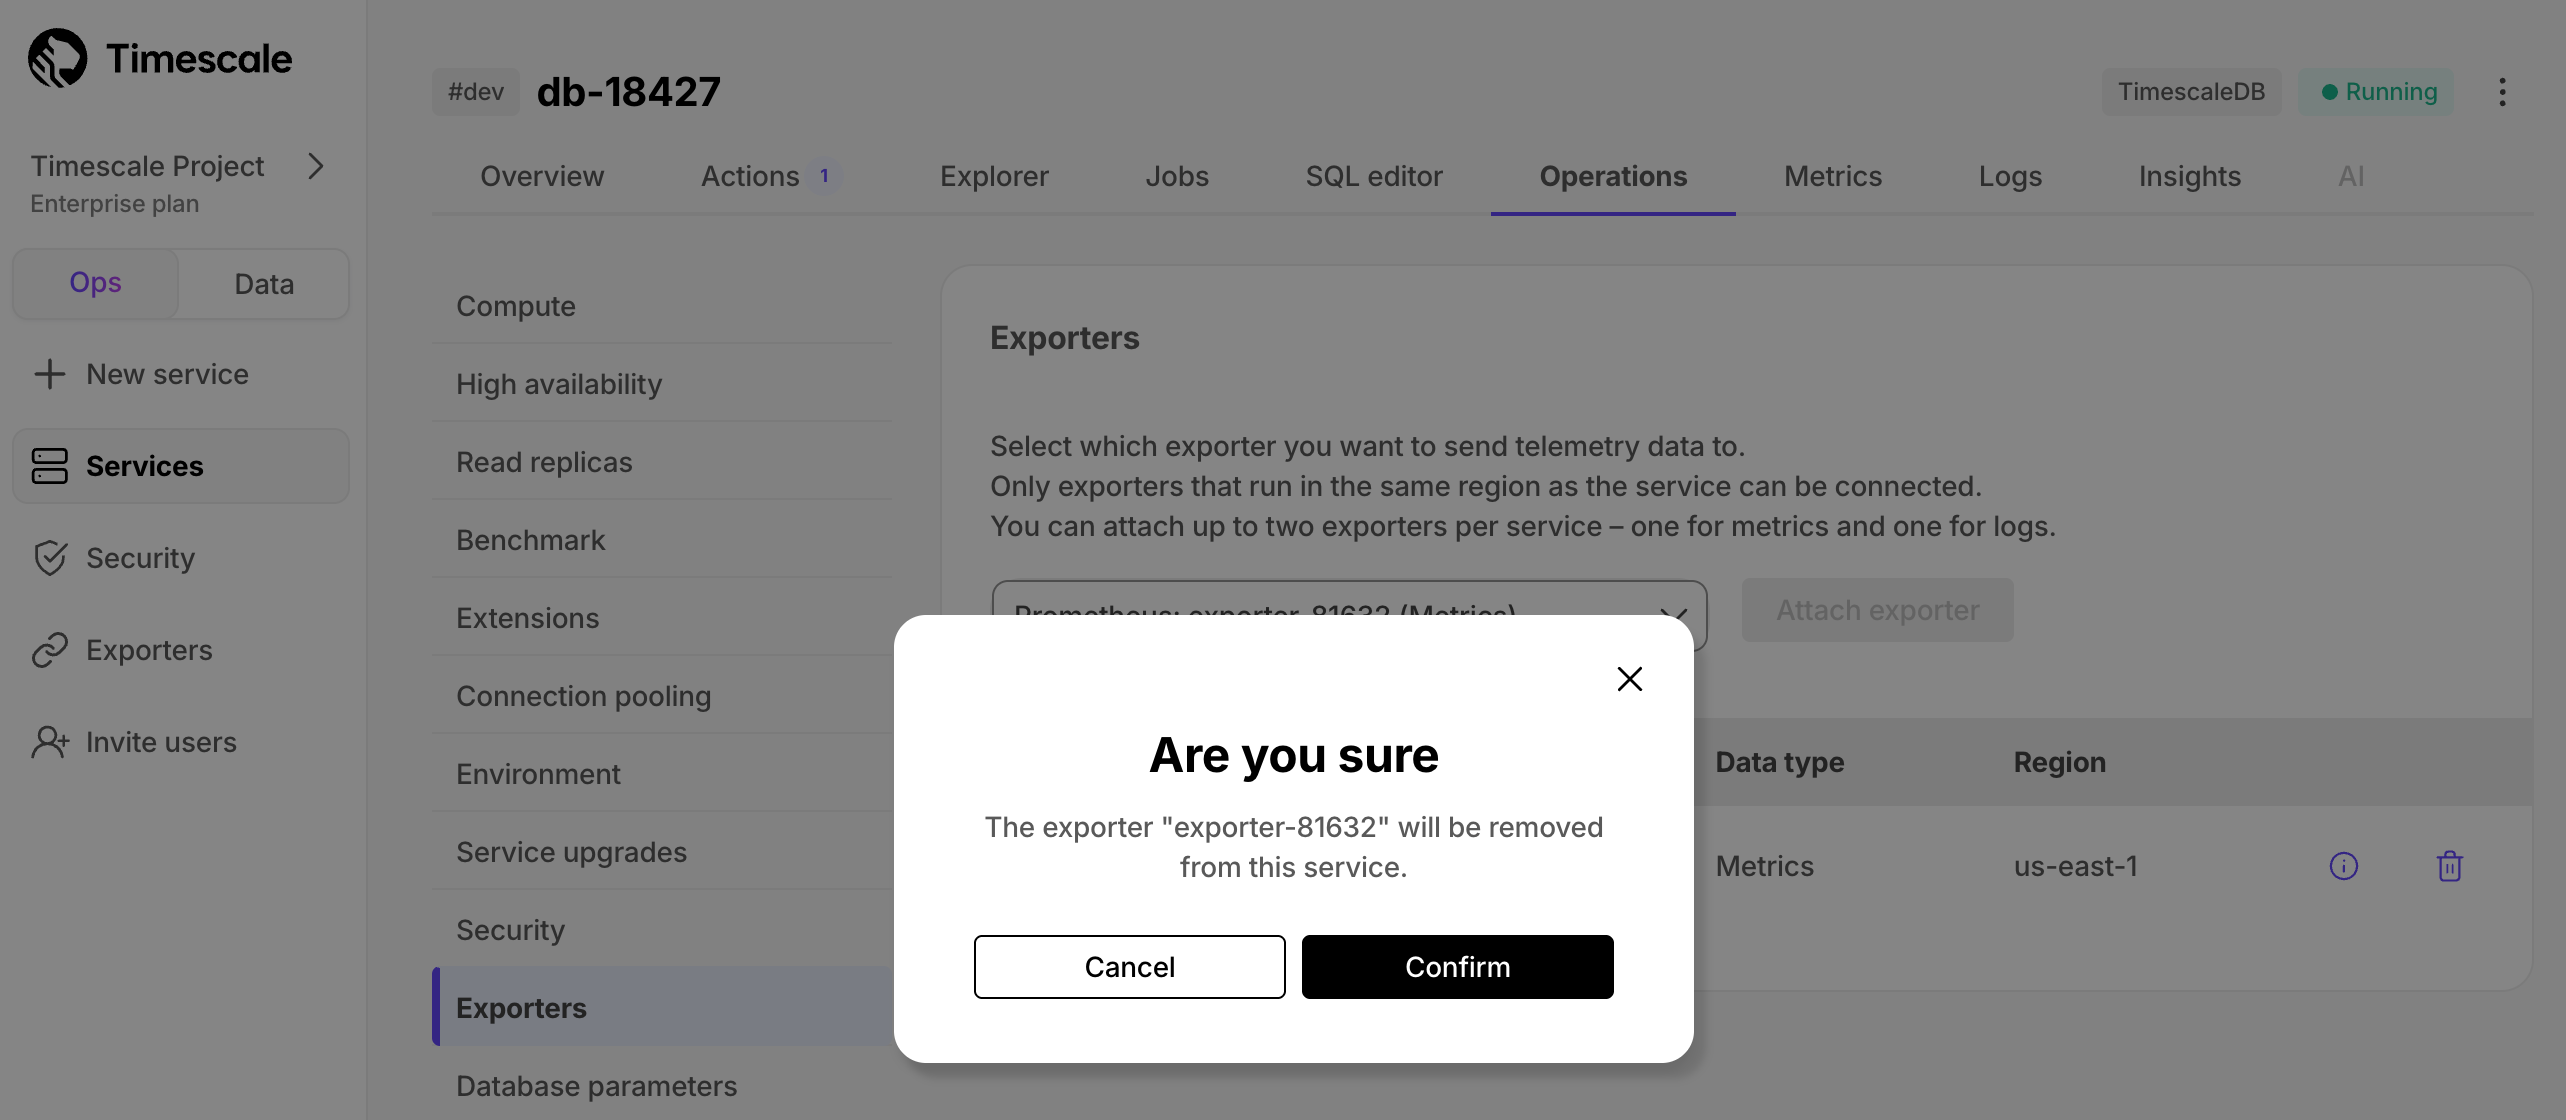
| The exporter is now attached to your $SERVICE_SHORT. To unattach it, click the trash icon in the exporter list. | ||
| The exporter is now attached to your $SERVICE_SHORT. To unattach it, click the trash icon in the exporter list. | ||
|
|
||
|  | ||
|  | ||
|
|
||
| 1. **Configure the Prometheus scrape target** | ||
|
|
||
| 1. Select your service, then click `Operations` > `Exporters` and click the information icon next to the exporter. You see the exporter details. | ||
| 1. Select your service, then click `Operations` > `Exporters` and click the information icon next to the exporter. You see the exporter details. | ||
|
|
||
| 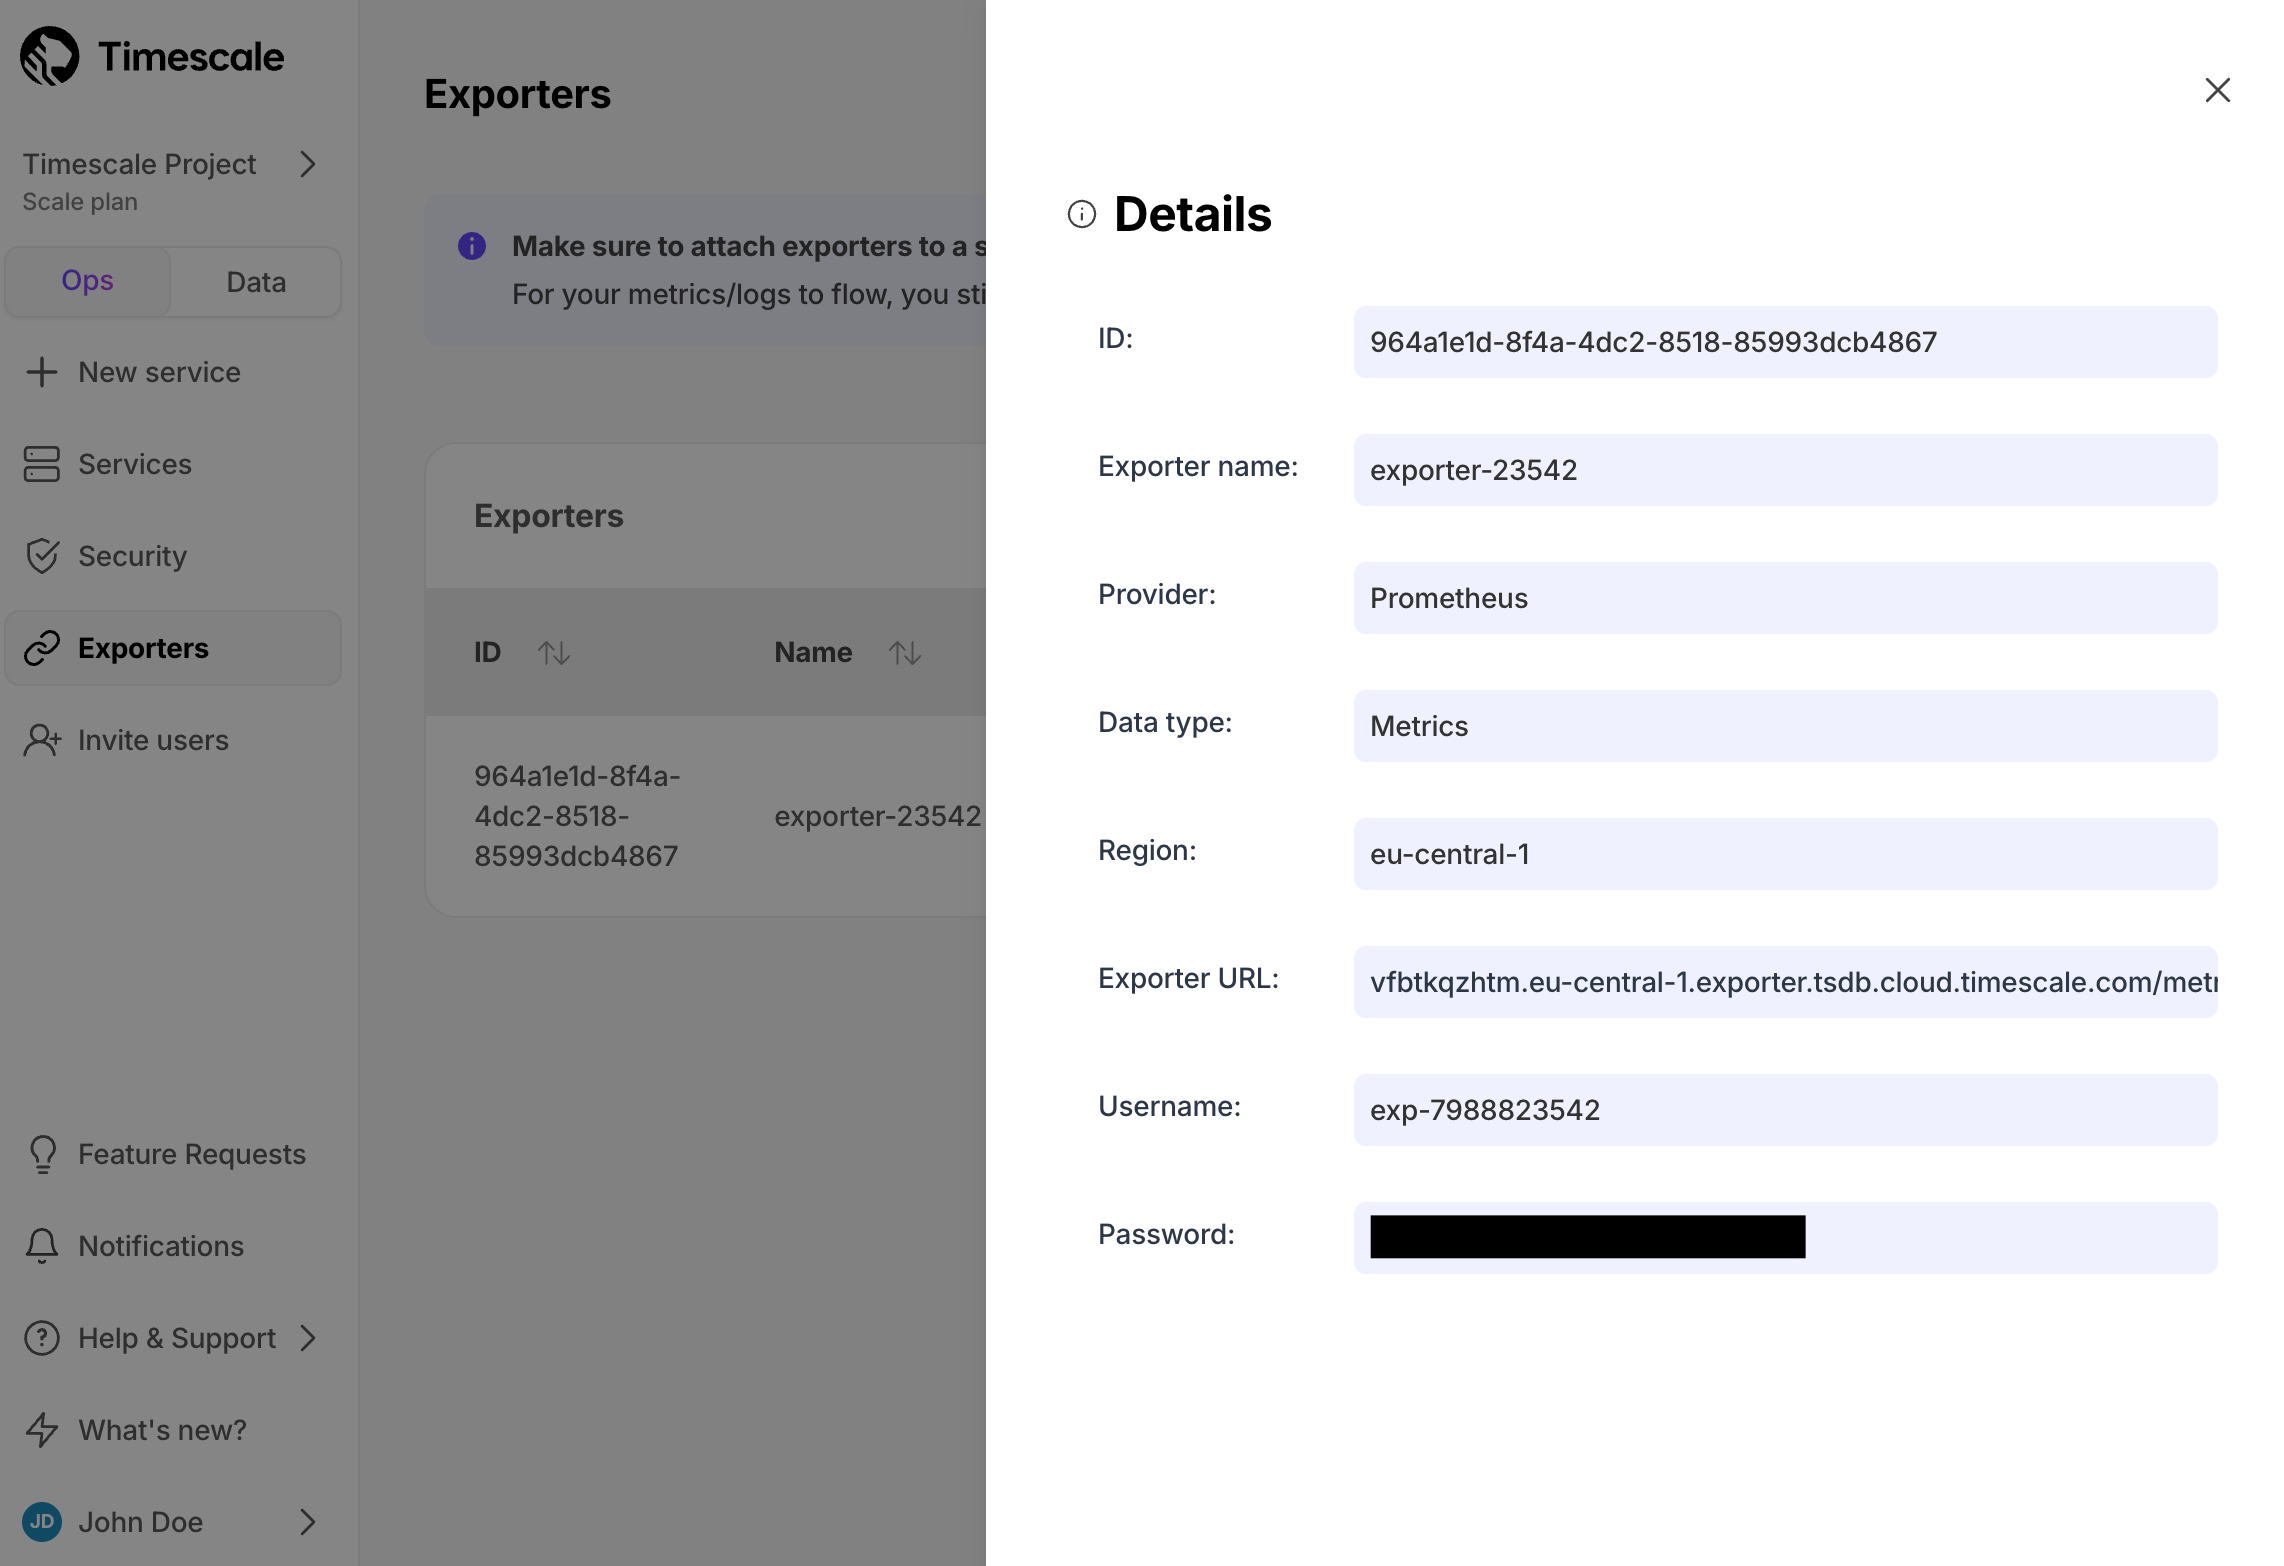 | ||
|
|
||
| 1. Copy the exporter URL. | ||
|
|
||
| 1. In your Prometheus installation, update `prometheus.yml` to point to the exporter URL as a scrape target: | ||
|
|
||
| ```yml | ||
| scrape_configs: | ||
| - job_name: "timescaledb-exporter" | ||
| scheme: https | ||
| static_configs: | ||
| - targets: ["my-exporter-url"] | ||
| basic_auth: | ||
| username: "user" | ||
| password: "pass" | ||
| ``` | ||
|
|
||
| See the [Prometheus documentation][scrape-targets] for details on configuring scrape targets. | ||
|
|
||
| You can now monitor your $SERVICE_SHORT metrics. Use the following metrics to check the service is running correctly: | ||
|
|
||
| * `timescale.cloud.system.cpu.usage.millicores` | ||
| * `timescale.cloud.system.cpu.total.millicores` | ||
| * `timescale.cloud.system.memory.usage.bytes` | ||
| * `timescale.cloud.system.memory.total.bytes` | ||
| * `timescale.cloud.system.disk.usage.bytes` | ||
| * `timescale.cloud.system.disk.total.bytes` | ||
|
|
||
| Additionally, use the following tags to filter your results. | ||
|
|
||
| |Tag|Example variable| Description | | ||
| |-|-|----------------------------| | ||
| |`host`|`us-east-1.timescale.cloud`| | | ||
| |`project-id`|| | | ||
| |`service-id`|| | | ||
| |`region`|`us-east-1`| AWS region | | ||
| |`role`|`replica` or `primary`| For $SERVICE_SHORT with replicas | | ||
|
|
||
| </Procedure> | ||
|
|
||
| </Tab> | ||
|
|
||
| <Tab title="Using PostgreSQL Exporter"> | ||
|
|
||
| <Procedure> | ||
|
|
||
| You import your $SERVICE_LONG metrics into PostgreSQL Exporter, then configure Prometheus to scrape metrics from it. | ||
|
|
||
| 1. **Create a user to access your $SERVICE_LONG metrics** | ||
|
|
||
| 1. Connect to your $SERVICE_SHORT using your [connection details][connection-info]. | ||
|
|
||
| 1. Create a user named `monitoring` with a secure password: | ||
|
|
||
| ```sql | ||
| CREATE USER monitoring WITH PASSWORD '<password>'; | ||
| ``` | ||
|
|
||
| 1. Grant the `pg_read_all_stats` permission to the `monitoring` user: | ||
|
|
||
| ```sql | ||
| GRANT pg_read_all_stats to monitoring; | ||
| ``` | ||
|
|
||
| 1. **Import your $SERVICE_SHORT metrics to PostgreSQL Exporter** | ||
|
|
||
| 1. Connect PostgreSQL Exporter to your $SERVICE_SHORT: | ||
|
|
||
|  | ||
| Use your [connection details][connection-info] to import your $SERVICE_SHORT metrics. You connect as | ||
| the `monitoring` user: | ||
|
|
||
| 1. Copy the exporter URL. | ||
| - Local installation: | ||
| ```shell | ||
| export DATA_SOURCE_NAME="postgres://monitoring:<password>@<host>.tsdb.cloud.timescale.com:<port>/tsdb?sslmode=require" | ||
| ./postgres_exporter | ||
| ``` | ||
| - Docker: | ||
| ```shell | ||
| docker run -d \ | ||
| -e DATA_SOURCE_NAME="postgres://monitoring:<password>@<host>.tsdb.cloud.timescale.com:<port>/tsdb?sslmode=require" \ | ||
| -p 9187:9187 \ | ||
| prometheuscommunity/postgres-exporter | ||
| ``` | ||
|
|
||
| 1. Configure the following labels for your $SERVICE_SHORT in PostgreSQL Exporter: | ||
|
|
||
| - `project_id` | ||
| - `service_id` | ||
| - `region` | ||
|
|
||
| 1. Check the metrics for your $SERVICE_SHORT in the Prometheus format: | ||
|
|
||
| 1. In your Prometheus installation, update `prometheus.yml` to point to the exporter URL as a scrape target: | ||
| - Browser: | ||
|
|
||
| ```yml | ||
| scrape_configs: | ||
| - job_name: "timescaledb-exporter" | ||
| scheme: https | ||
| Navigate to `http://<exporter-host>:9187/metrics`. | ||
|
|
||
| - Command line: | ||
| ```shell | ||
| curl http://<exporter-host>:9187/metrics | ||
| ``` | ||
|
|
||
| 1. **Configure Prometheus to scrape metrics** | ||
|
|
||
| 1. In your Prometheus installation, update `prometheus.yml` to point to your PostgreSQL Exporter instance as a scrape | ||
| target. In the following example, you replace `<exporter-host>` with the hostname or IP address of the PostgreSQL | ||
| Exporter. | ||
|
|
||
| ```yaml | ||
| global: | ||
| scrape_interval: 15s | ||
|
|
||
| scrape_configs: | ||
| - job_name: 'postgresql' | ||
| static_configs: | ||
| - targets: ["my-exporter-url"] | ||
| basic_auth: | ||
| username: "user" | ||
| password: "pass" | ||
| ``` | ||
|
|
||
| See the [Prometheus documentation][scrape-targets] for details on configuring scrape targets. | ||
|
|
||
| You can now monitor your $SERVICE_SHORT metrics. Use the following metrics to check the service is running correctly: | ||
|
|
||
| * `timescale.cloud.system.cpu.usage.millicores` | ||
| * `timescale.cloud.system.cpu.total.millicores` | ||
| * `timescale.cloud.system.memory.usage.bytes` | ||
| * `timescale.cloud.system.memory.total.bytes` | ||
| * `timescale.cloud.system.disk.usage.bytes` | ||
| * `timescale.cloud.system.disk.total.bytes` | ||
|
|
||
| Additionally, use the following tags to filter your results. | ||
|
|
||
| |Tag|Example variable| Description | | ||
| |-|-|----------------------------| | ||
| |`host`|`us-east-1.timescale.cloud`| | | ||
| |`project-id`|| | | ||
| |`service-id`|| | | ||
| |`region`|`us-east-1`| AWS region | | ||
| |`role`|`replica` or `primary`| For $SERVICE_SHORT with replicas | | ||
|
|
||
| - targets: ['<exporter-host>:9187'] | ||
| ``` | ||
|
|
||
| If `prometheus.yml` has not been created during installation, create it manually. If you are using Docker, you can | ||
|
There was a problem hiding this comment. Choose a reason for hiding this commentThe reason will be displayed to describe this comment to others. Learn more. "If There was a problem hiding this comment. Choose a reason for hiding this commentThe reason will be displayed to describe this comment to others. Learn more. We're telling to update the file, but there is a possibility it hasn't been created. |
||
| find the IPAddress in `Inspect` > `Networks` for the container running PostgreSQL Exporter. | ||
|
|
||
| 1. Restart Prometheus. | ||
|
|
||
| 1. Check the Prometheus UI at `http://<prometheus-host>:9090/targets` and `http://<prometheus-host>:9090/tsdb-status`. | ||
|
|
||
| You see the PostgreSQL Exporter target and the metrics scraped from it. | ||
|
|
||
| </Procedure> | ||
|
|
||
|
|
||
| </Tab> | ||
|
|
||
| </Tabs> | ||
|
|
||
| </Tab> | ||
|
|
||
| <Tab title="Self-hosted TimescaleDB"> | ||
|
|
||
| <Procedure> | ||
|
|
||
| To export metrics from $SELF_LONG, you import telemetry data about your database to PostgreSQL Exporter, then configure Prometheus to scrape metrics from it. PostgreSQL Exporter exposes metrics that you define, excluding the system metrics. | ||
| You export metrics from $SELF_LONG to PostgreSQL Exporter, then configure Prometheus to scrape metrics from it. | ||
|
|
||
| 1. **Create a user to access telemetry data about your database** | ||
| 1. **Create a user to access your database metrics** | ||
|
|
||
| 1. Connect to your database in [`psql`][psql] using your [connection details][connection-info]. | ||
|
|
||
|
|
@@ -130,11 +235,11 @@ To export metrics from $SELF_LONG, you import telemetry data about your database | |
| GRANT pg_read_all_stats to monitoring; | ||
| ``` | ||
|
|
||
| 1. **Import telemetry data about your database to PostgreSQL Exporter** | ||
| 1. **Import your database metrics to PostgreSQL Exporter** | ||
|
|
||
| 1. Connect PostgreSQL Exporter to your database: | ||
|
|
||
| Use your [connection details][connection-info] to import telemetry data about your database. You connect as | ||
| Use your [connection details][connection-info] to import your database metrics. You connect as | ||
| the `monitoring` user: | ||
|
|
||
| - Local installation: | ||
|
|
@@ -150,7 +255,7 @@ To export metrics from $SELF_LONG, you import telemetry data about your database | |
| prometheuscommunity/postgres-exporter | ||
| ``` | ||
|
|
||
| 1. Check the metrics for your database in the Prometheus format: | ||
| 1. Check your database metrics in the Prometheus format: | ||
|
|
||
| - Browser: | ||
|
|
||
|
|
||
Uh oh!
There was an error while loading. Please reload this page.