[RabbitMQ Cluster Operator] Need help setting up Prometheus #5122
-
|
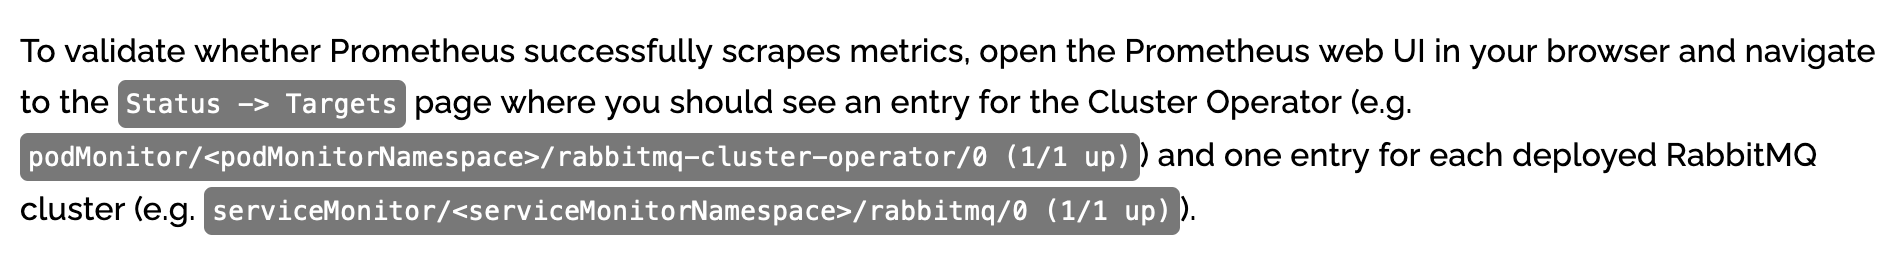
I have a RabbitMQ cluster deployed on Kubernetes using the kubectl rabbitmq plugin by following this guide (https://www.rabbitmq.com/kubernetes/operator/quickstart-operator.html) Prometheus was deployed on same Kubernetes cluster in 'monitoring' namespace using kube-prometheus-stack helm chart (https://artifacthub.io/packages/helm/prometheus-community/kube-prometheus-stack) And then I followed https://www.rabbitmq.com/kubernetes/operator/operator-monitoring.html to connect RabbitMQ to Prometheus. Prometheus & Grafana works fine, but I'm not able to see any entry for RabbitMQ in Targets section of Prometheus UI like it's mentioned here: Targets page is only showing Prometheus related stuff. Am I missing something or doing something wrong? |
Beta Was this translation helpful? Give feedback.
Replies: 2 comments 4 replies
-
|
I see you are now asking questions that suggest you have passed this stage. Is this still an issue? |
Beta Was this translation helpful? Give feedback.
-
|
yes, this was resolved |
Beta Was this translation helpful? Give feedback.
-
|
Hey, Do you have any info on how you resolved the issue? I am following the exact steps but can't seem to make the operator/prometheus to scrape the pod or service monitors. |
Beta Was this translation helpful? Give feedback.
-
|
The guide didn't work for me too. So I cleaned up everything and started from scratch, referencing this quickstart bash script instead of the guide. Worked perfectly after that! |
Beta Was this translation helpful? Give feedback.
-
|
Later on I created my own bash script, tweaked the various options for my use case. |
Beta Was this translation helpful? Give feedback.
-
|
Thank you for the info. I saw the script but didn't even guess that it used the |
Beta Was this translation helpful? Give feedback.
I see you are now asking questions that suggest you have passed this stage. Is this still an issue?