Replies: 1 comment
-
|
I've emailed https://ntesmo.com.au/contact asking about other data sources. |
Beta Was this translation helpful? Give feedback.
0 replies
Sign up for free
to join this conversation on GitHub.
Already have an account?
Sign in to comment
Uh oh!
There was an error while loading. Please reload this page.
Uh oh!
There was an error while loading. Please reload this page.
-
Starting a spot to aggregate details around the various power networks in Australia's Northern Territory.
Discussion rather than feature request, as its not detailed enough to act on yet.
Overview
https://en.wikipedia.org/wiki/Territory_Generation
From brief reading, there are three main grids - Darwin and surrounds, Alice Springs, and Tennant Creek.
https://www.powerwater.com.au/about/what-we-do/power-networks-and-supply
A number of smaller grids exist too.
There is an energy market operator.
They produce some forecasting and demand data, daily, in an excel format.
There does not appear to be real time data.
There are details of various generators available, potentially enough to estimate.
https://ntesmo.com.au/ - some CSV format data for demand and forecast, alice springs
https://territorygeneration.com.au/about-us/our-power-stations/ various details of generators, perhaps suitable to estimate with.
Things to explore:
Tennant Creek Grid
Geometry
https://www.openstreetmap.org/relation/11716689 - also probably smaller than the actual grid
Alice Springs Grid
Geometry
https://www.openstreetmap.org/relation/9045378 - probably not complete; but it covers a major population centre.
Data available
Demand
CSV and JSON format
https://ntesmo.com.au/data/energy-dashboard/resources/newapis/aws_alice_forecast_api/_nocache?SQ_ASSET_CONTENTS_RAW
Units of demand are MW, based on charts available.
Seems like a good fit for:
https://github.com/electricitymap/electricitymap-contrib/wiki/Building-a-new-parser#fetch_consumption
Darwin to Katherine Grid
https://openinframap.org/#6.62/-13.552/131.67 has some details of the darwin grid
Geometry
Is it worthwhile doing the town boundaries + 20km radius of the main high voltage line to represent this?
Demand
It seem like there is also NT wide data for demand, on a daily basis/published historically with pricing - ie: 100MW-180MW shown here.
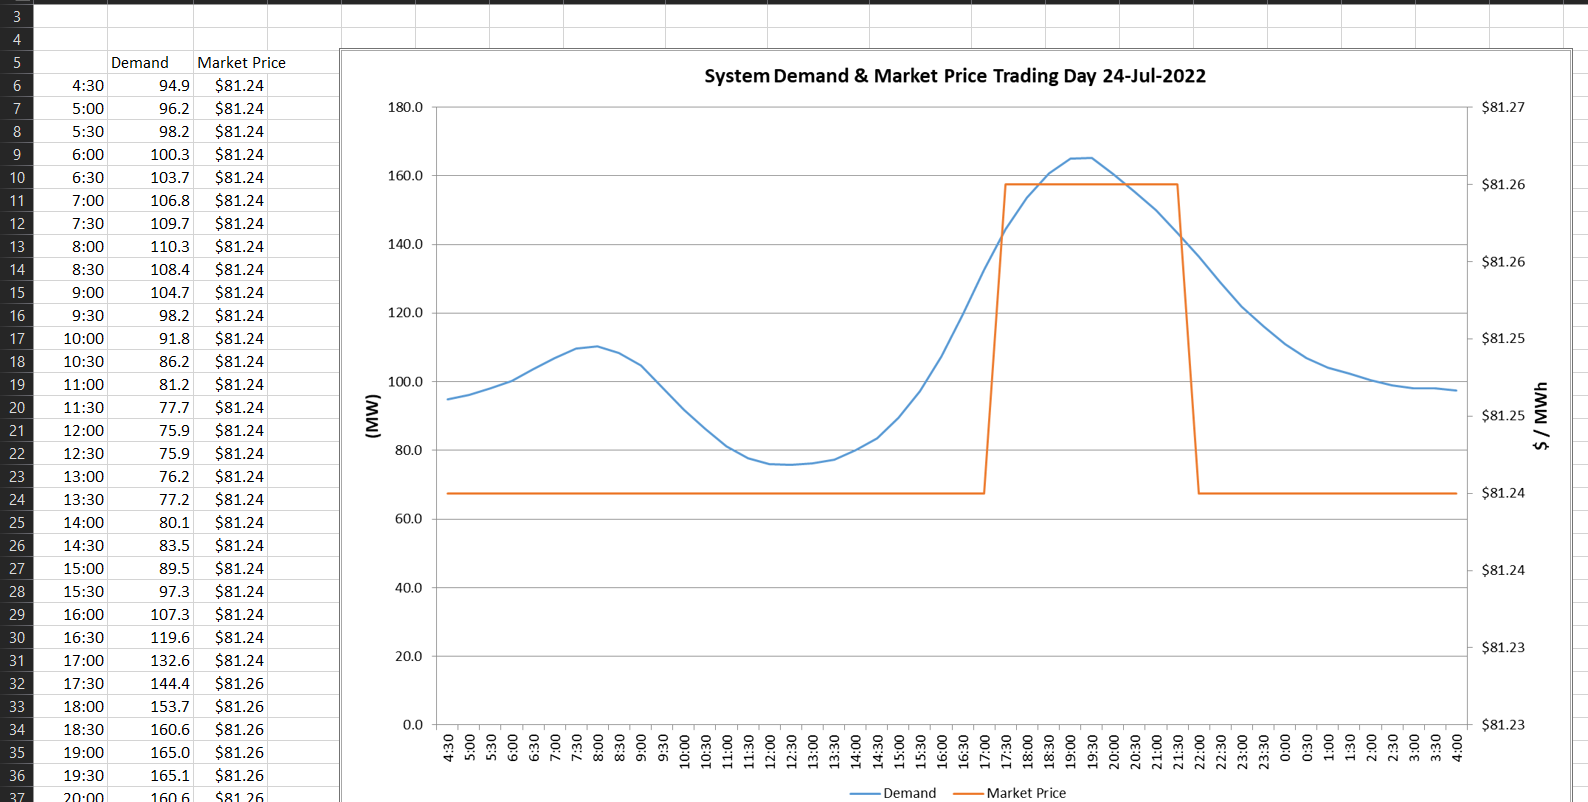
https://ntesmo.com.au/data
Roadmap
https://territoryrenewableenergy.nt.gov.au/strategies-and-plans/electricity-system-plans - 320MW future renewables hub
Beta Was this translation helpful? Give feedback.
All reactions